How to Report on Gross Profit in Google Analytics
As digital marketers, we rely heavily on data to show us if we’re doing a good job. We typically assume that if revenue and traffic are up that we’re kicking goals for the business. And we all give ourselves a pat on the back.

But as any accountant or CFO will tell you, revenue ain’t worth squat if it’s not resulting in profit. Just to take it right back to business school and get everyone on the same page:
Revenue – Cost = Profit
So, if profit is more important than revenue…
WHY AREN’T WE REPORTING AND OPTIMISING TOWARDS IT?
The answer is simple, profit reporting in our analytics tools (like Google Analytics) is tricky. It’s tricky for 2 reasons:
- Technical: getting up-to-date costs for all of your products into analytics on a real-time basis requires a bit of technical work.
- Trust: having an up-to-date list of the cost of all products represents a new level of trust required from the business. That list is an extremely sensitive source of information.
Today we’re going to focus on the technical, but we will show you some implementation methods that will make the CFO’s ears prick up.
Reporting Gross Profit in Google Analytics
First, I want to define what gross profit is. If you don’t care, or you don’t need to speak in your CFO’s language, skip ahead. Gross profit refers to removing the cost of making and selling a product from revenue. This excludes fixed costs within the business such as rent, finance costs, wages, and the cost of keeping the website online. The cost of making and selling a product is referred to as cost of goods sold (we’ll refer to it as COGS from here on).
Gross Profit = Revenue – COGS
This COGS metric, is the main challenge that we’ll face in setting up gross profit tracking in Google Analytics. The reason for this is that the cost that a business pays for every product is different. Consider the table below:

If we were to report on revenue, we’d be looking to sell as many wool socks as possible because it has the highest price. However, we’re going to be making more gross profit if we sell more cotton socks.
Focusing on gross profit gets even more interesting when products are on sale – let’s look at a 25% off sale.

Once again, we’d usually be patting ourselves on the back because the sale increased revenue 50%! However, during that time, gross profit dropped by 25%.
There are strategic reasons that a business might be happy to forego profit in favour of transactions or revenue including:
- Acquiring new customers, knowing that their lifetime value will make up for the short-term drop in profit
- Clearing stock to make room for new product
- There’s some kind of loss-leader strategy in place.
However, under most other circumstances, this sale should be labelled as a failure. Not only was there less profit, but users will be getting trained to buy on sale. If your customers get used to seeing you on sale, they’ll stop buying at full price and wait for your next sale. To make things worse, they’ll probably only wait for higher percentage discounts. This is a slippery slope whereby you’ll end up only being able to sell product at cost price.
Let’s show you how to avoid this trap and focus on profit!
Gross Profit Reporting Instructions for Google Analytics
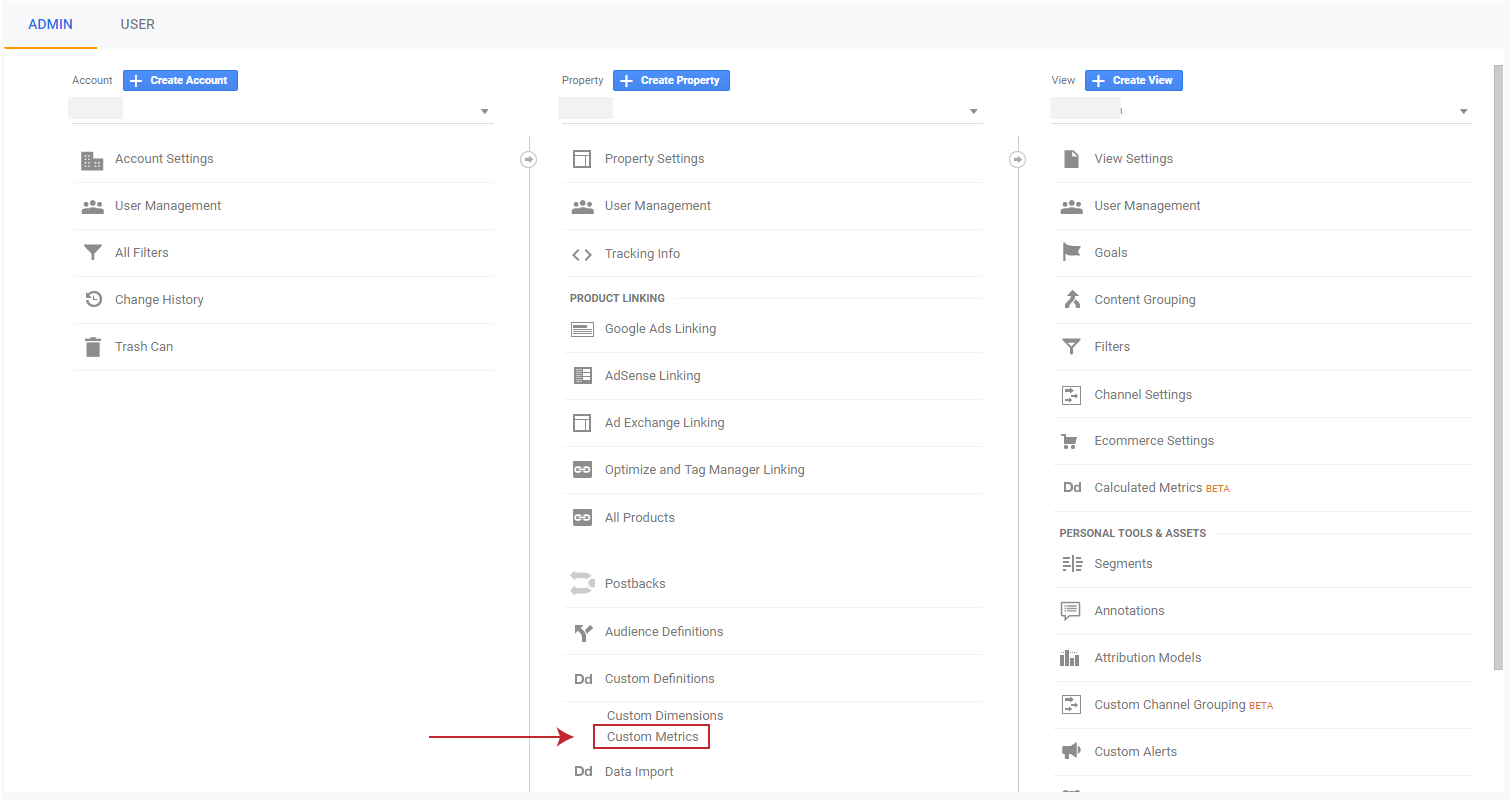
- Create a COGS custom metric in Google Analytics
Go into Google Analytics > Admin > Property > Custom Dimensions > Custom Metrics
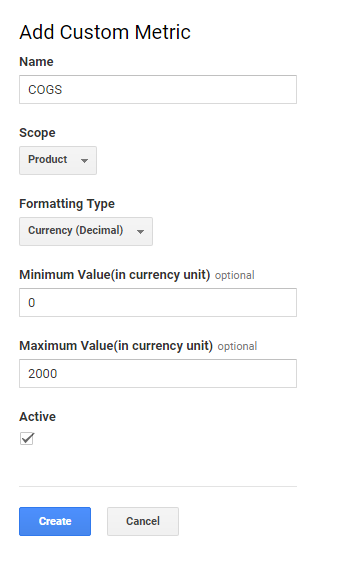
Click “Add Custom Metric” and fill out the details as follows:
Name your metric “COGS”
Scope “Product” – because we’ll be implementing this metric within the product scope
Formatting type “Currency” because we’ll be adding the cost of goods sold
Add the minimum and maximum cost of your products – this prevents any erroneous costs coming through in error.
Set it to active and click “create”
Click “Done” on the next screen
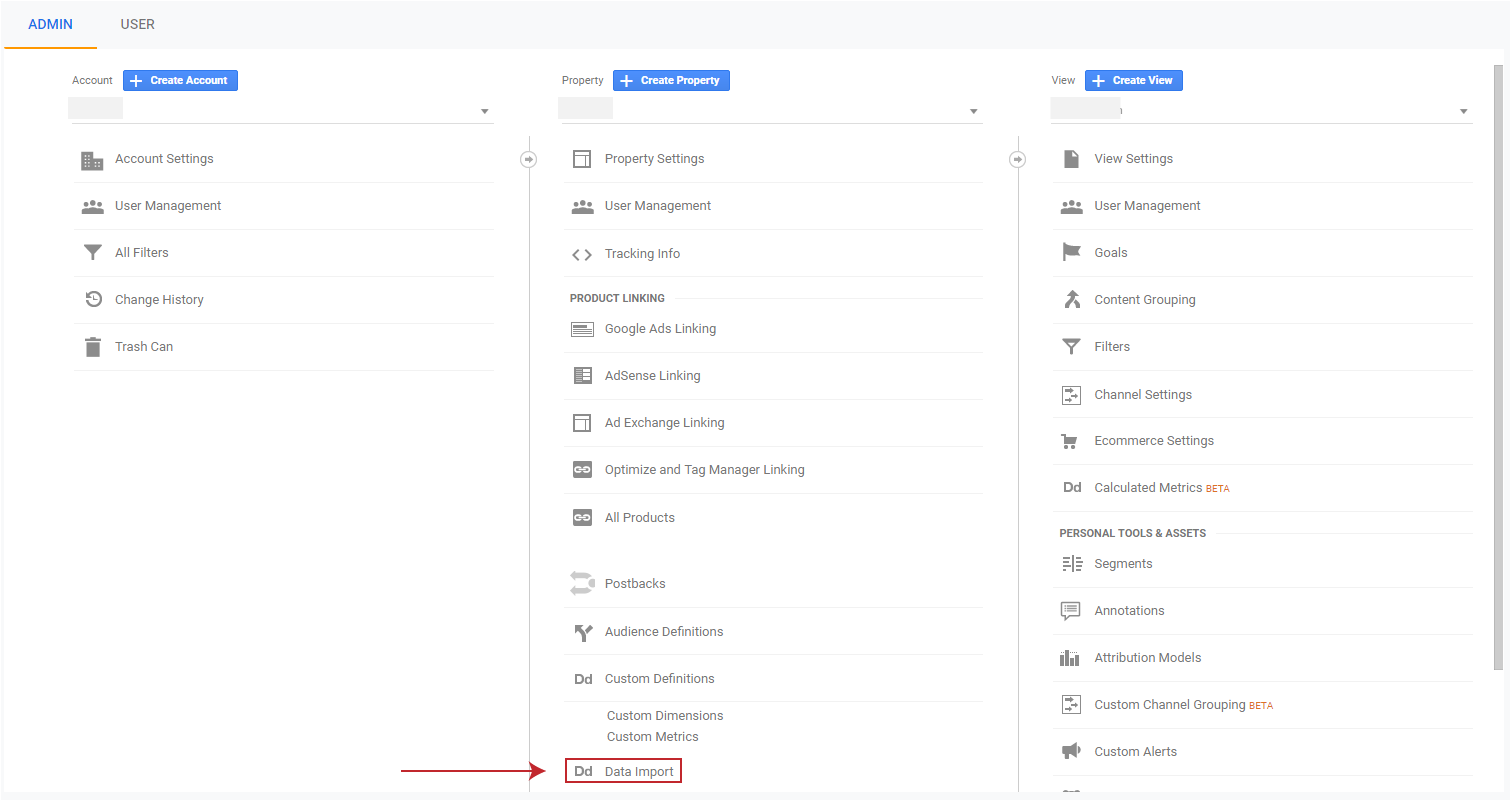
The metric is now configured and ready to receive data. - Do a data import of all products with COGS
There are 2 ways to import your product COGS into Google Analytics. The first, CSV import, is easier, but requires manual upload whenever products or prices change. The second, which uses the Analytics API, is better because you can hook up your ERP tables to analytics in near-real-time, but requires a lot more technical work. We’ll cover both.
CSV import
Go back to Google Analytics > Admin > Property > Data Import and then click “Create”
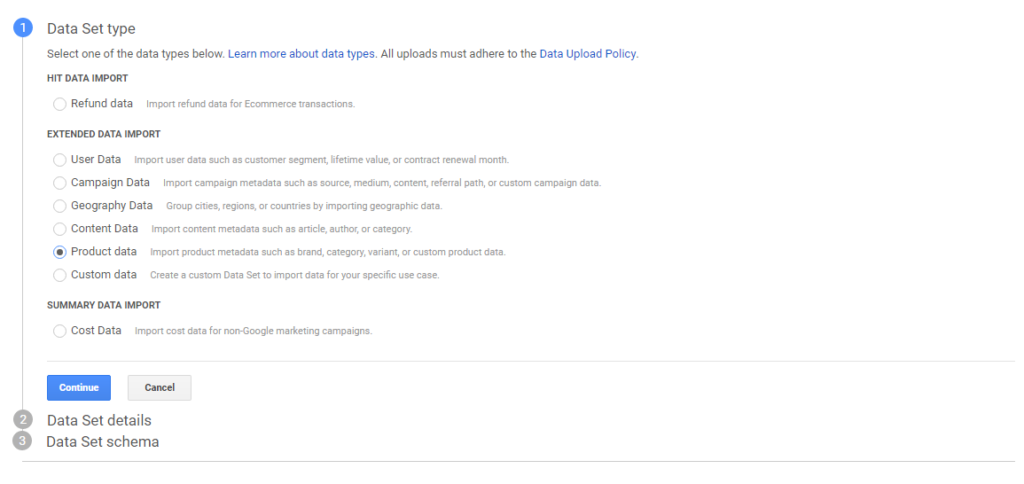
On the next screen, we want “Product Data”. Click continue.
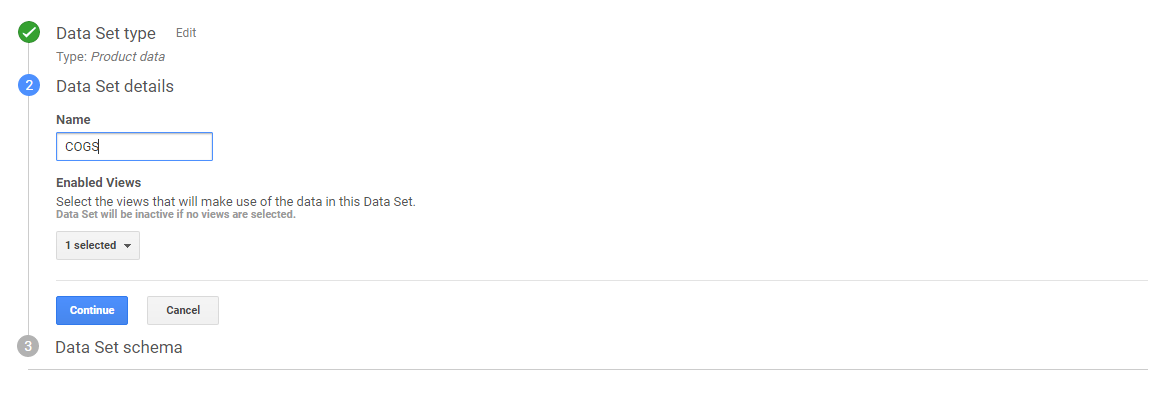
On the next screen, name your data “COGS” and select the view that you’d like it to show in
Select your metric in the import data drop-down
Select “no” on the overwrite hit data to avoid your other ecommerce data being overwritten by the import data – we only want the COGS data to be added.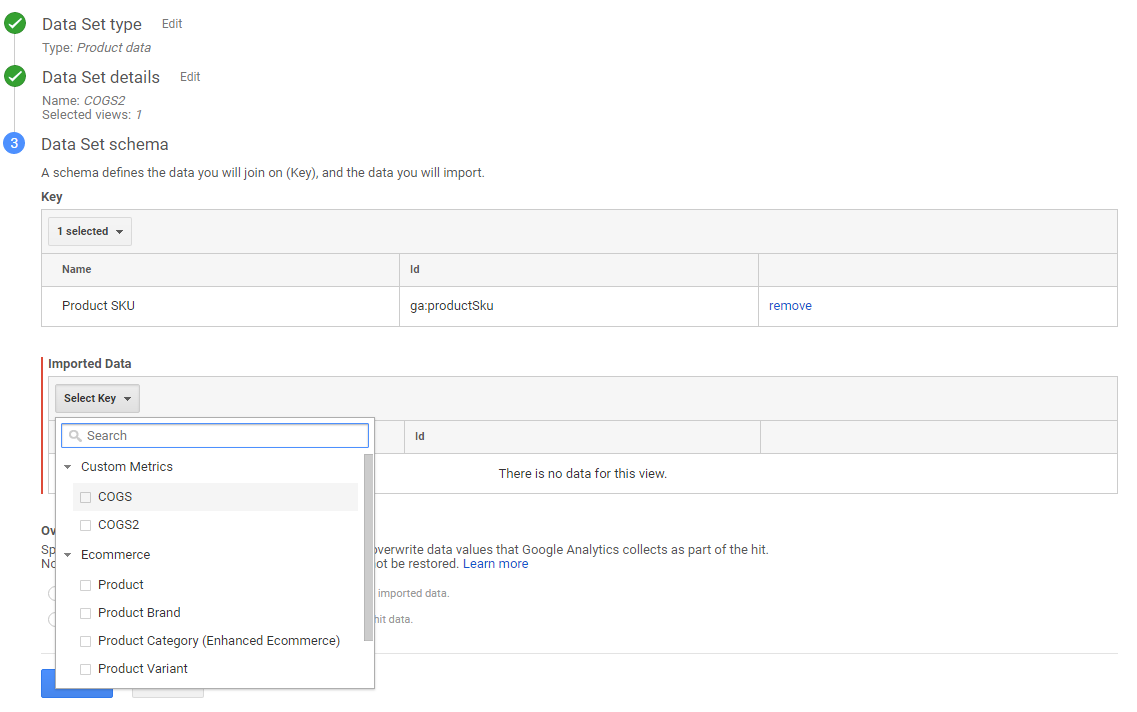
Click “save” – this will take you to the data import screen.
Preparing the file:
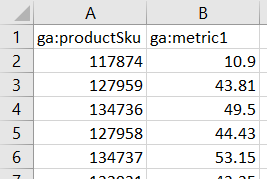
You’ll need to create a CSV file with 2 columns: the first needs to have the product SKU and the second, contains the COGS, they should be titled: ga:productSku and ga:metric1 – your file should look something like this
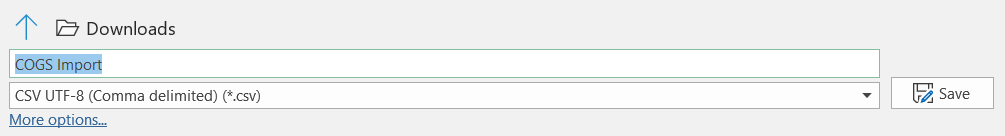
Save your file from Excel as a CSV UTF-8 to make sure Google can read it:
Now, in Analytics click “Upload File” and choose your CSV for upload – it will now begin the import
You may get an error your first time. The most common one, is that excel has automatically added a bunch of empty columns to the right. If this happens to you, open the file in notepad and do a find and replace on all of the empty columns (which will show as commas at the end of each line). There should be no comma at the end of each line.
Once Google has accepted your upload, your custom metric and data import should all be working. It took around 12 hours for mine to start showing up in Analytics, so you may need to be patient to check if it worked. We’ll show you how to create the custom report to check your new custom metric shortly.
API import
The other option for data import is via an API import. This option requires a lot more development work, so just pass the following guide from Google onto your developers for implementation. The principles are the same, it’s just that you can have a constantly-updated CSV that is systematically refreshed in analytics. This means that your COGS metric will be more accurate and include all new products as they become available.
Adding calculated metrics for Gross Profit and Gross Profit Margin
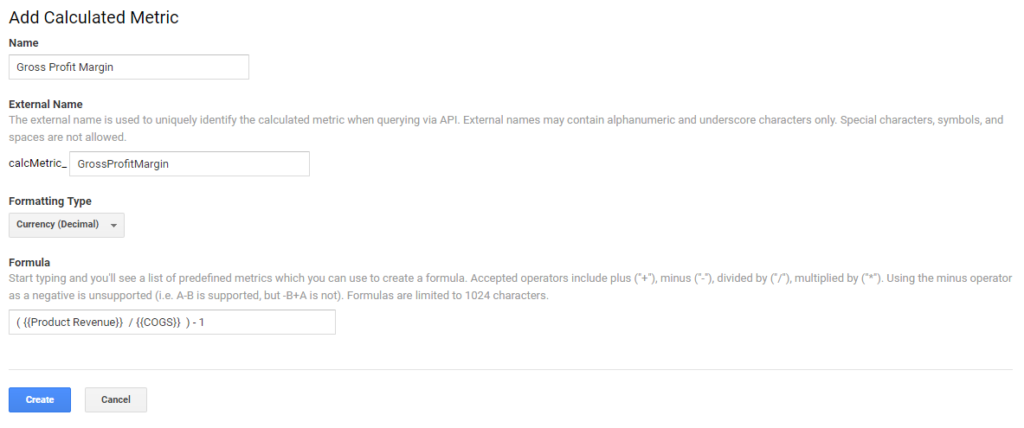
To take your metrics one step further, you can create a calculated metric for Gross Profit and Gross Profit Margin.
As a reminder, the formulas for Gross Profit and Gross Profit Margin are:
Gross Profit = Revenue – COGS
Gross Profit Margin = (Revenue/COGS)-1
To create a calculated metric for gross profit:
Go to Admin > View > Calculated Metrics
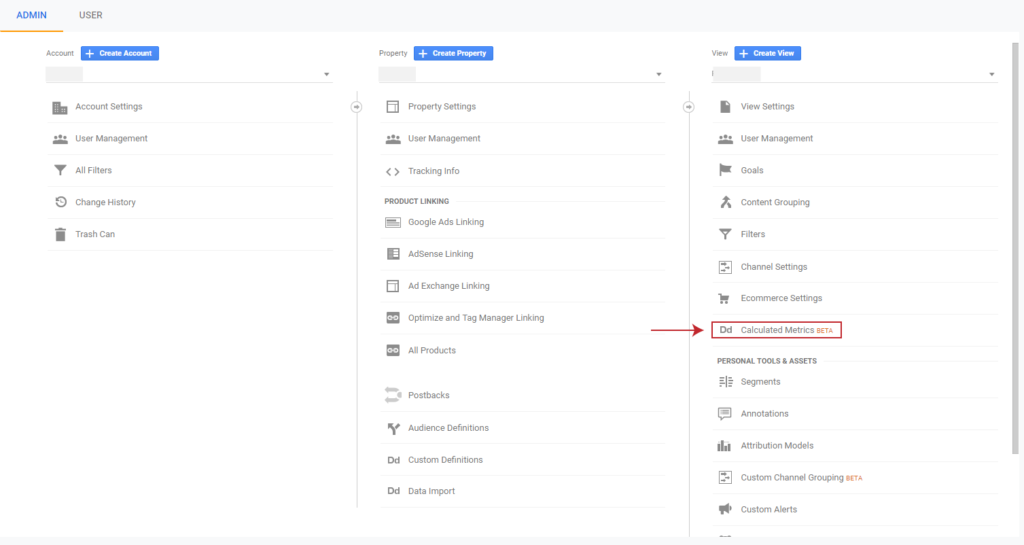
Click “new calculated metric” and fill out the details as follows:

Repeat the steps for the Gross Profit Margin Metric but with the following configuration
How to Utilise Gross Profit Reporting Further
- Data Visualisation
- Create a visualisation of the data in Google Data Studio to allow weekly or monthly analysis of Gross Profit.
- These visualisations can show which Google Ads Campaigns/Ad Groups/Keywords contribute the most to profit and show where ad spend should be allocated

- Split Testing
- The primary objective of an eCommerce split test is typically focused around revenue. However, certain changes may lead to more sales in higher profit items. Importing the gross profit custom metric into Google Optimize for profit-based decision making will mean that you’re optimising towards your bottom line.
- Running your digital assets’ accounting like a business
- Create a profit and loss statement for your digital activities that integrates online gross and fixed costs. This will allow you to run your website as you would a business, helping you to make smarter decisions about your online investments.
If you’re looking for assistance with digital analytics or profit reporting, contact us. We’d be excited to helping you further along your analytics journey.